Learn Anytime, Anywhere with Seven E-courses
20 April 2025

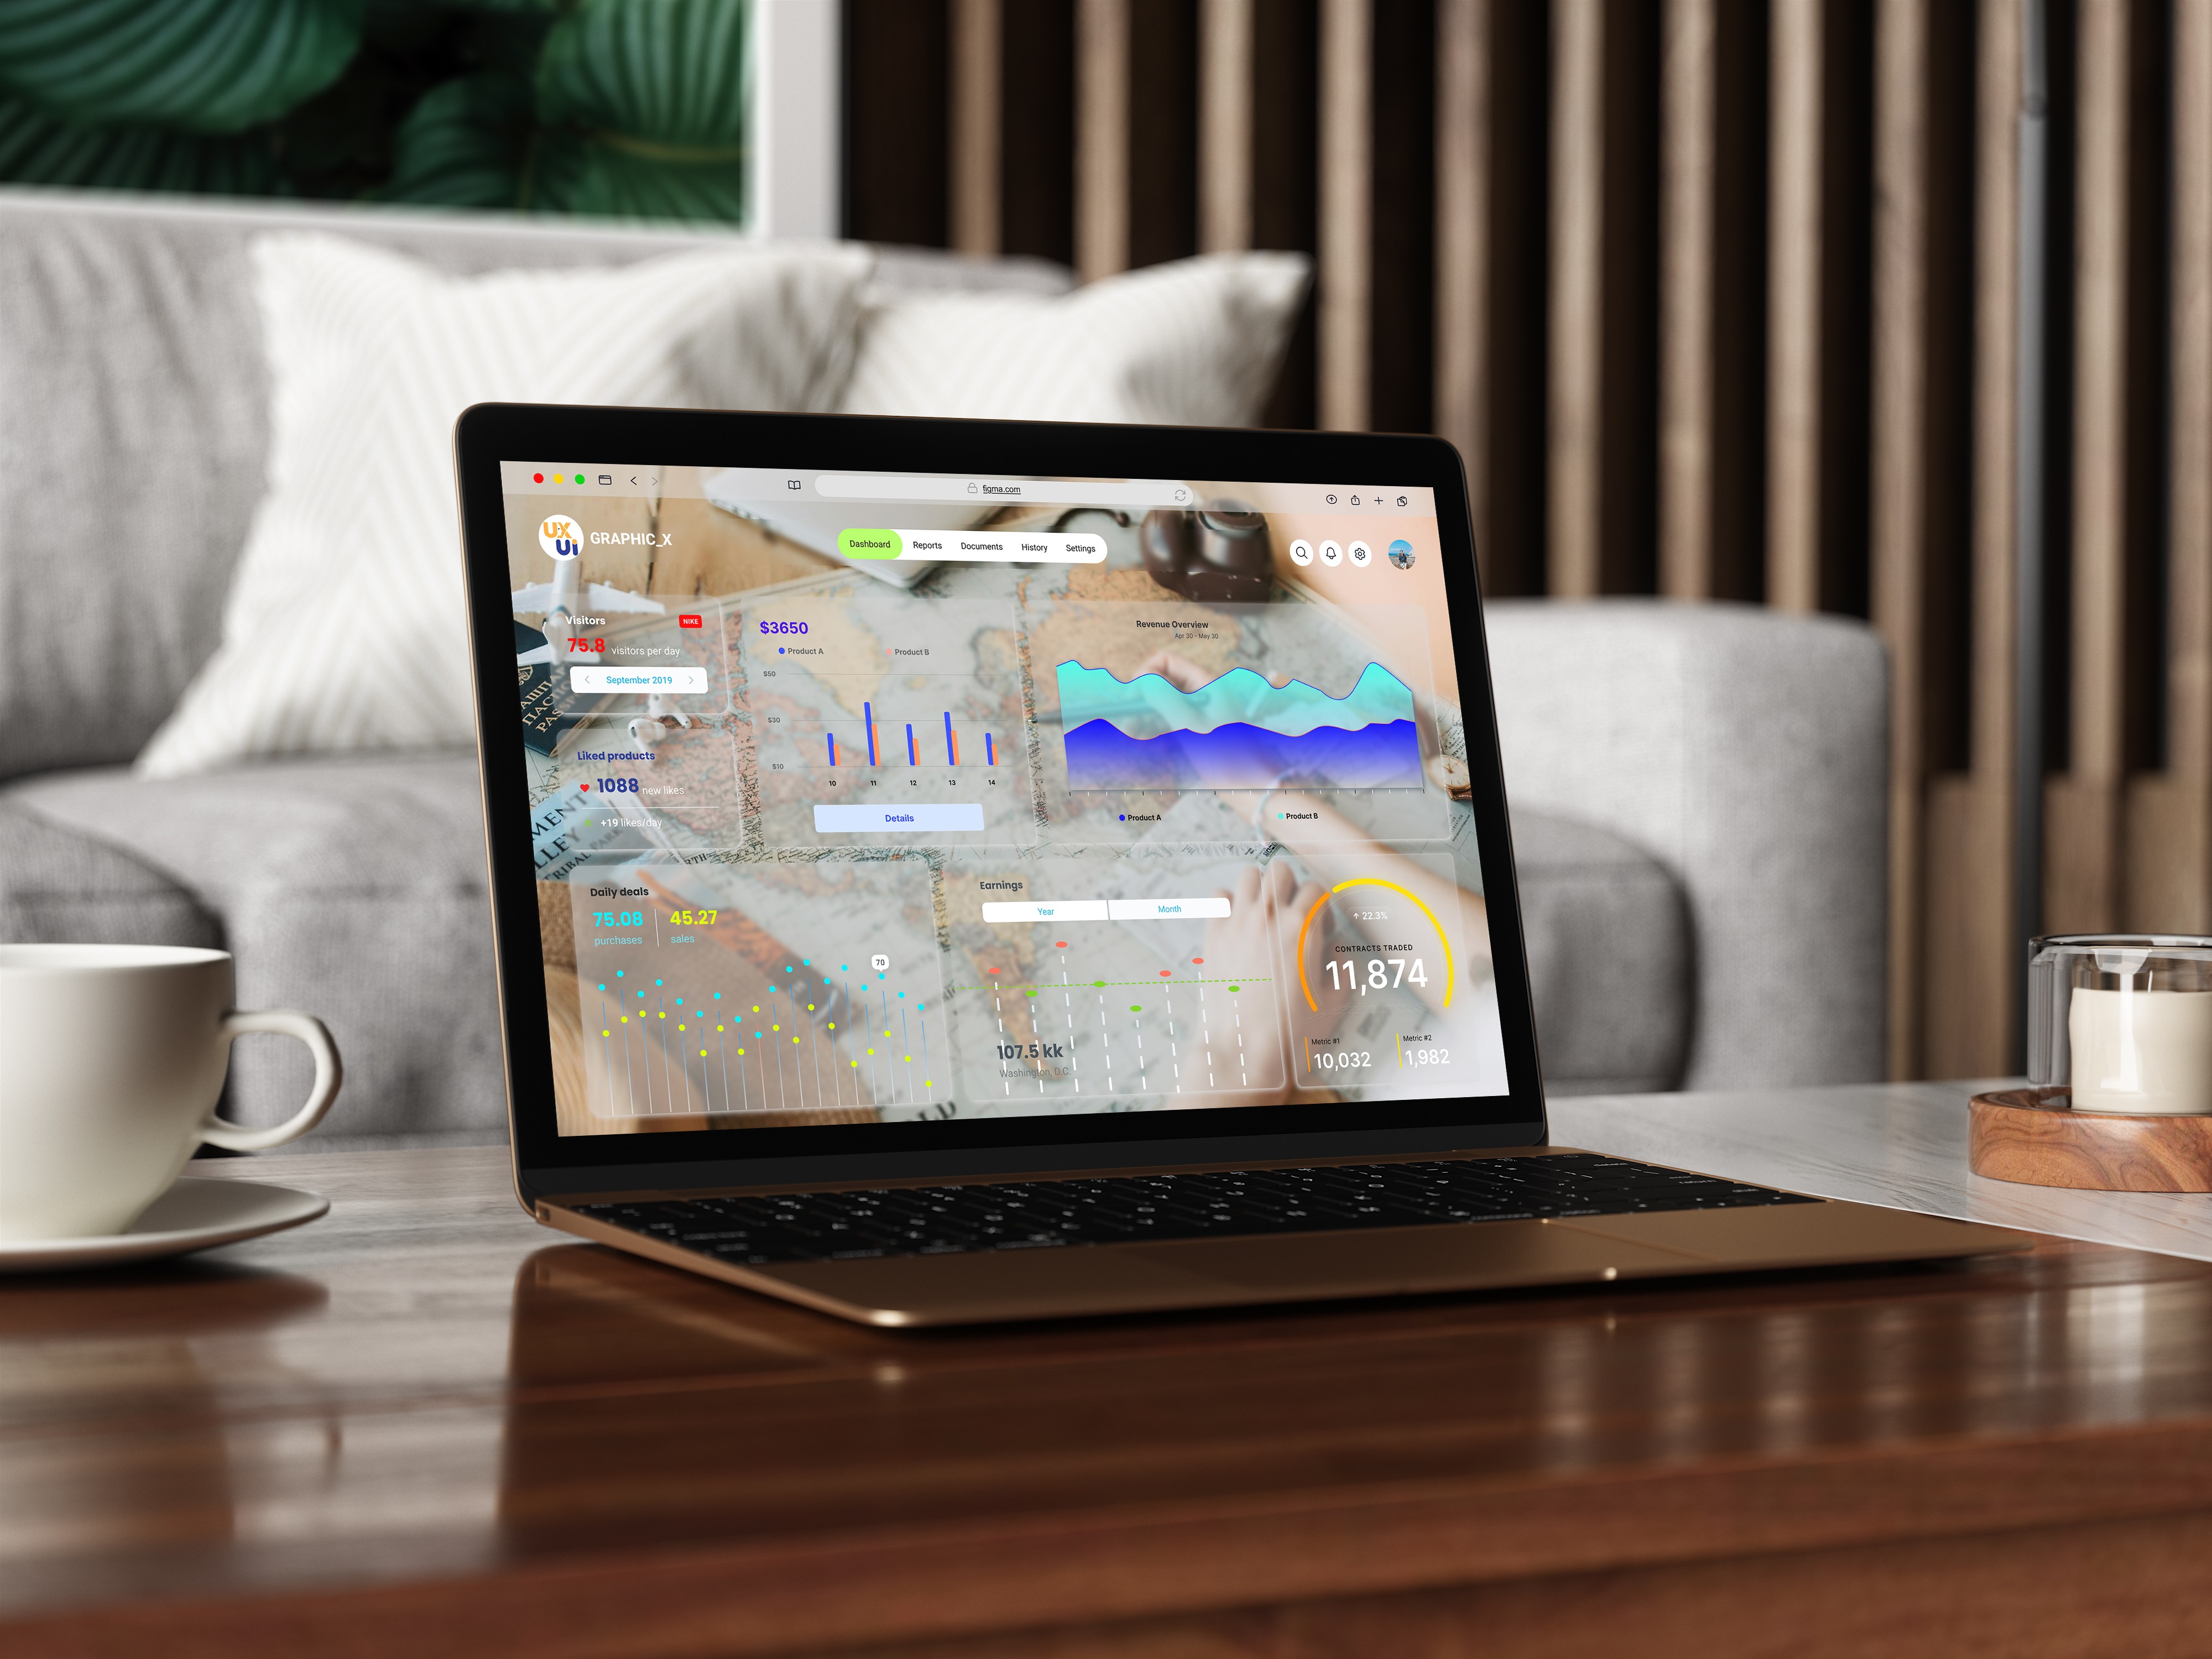


Here are some visible sections and data points:
Top Navigation Tabs:
Dashboard
Reports
Documents
History
Settings
User Info (Top Left):
Name: "UX UI GRAPHIC.X"
User image/icon present
Performance Metrics (on screen):
Visitors: 756 (highlighted with red)
Updated on: September 30th
Used projects: 1088
Revenue: $3650
Business Overview Chart: A line graph comparing Product 1 and Product 2
Earnings: 107.6K (highlighted yearly)
Daily Users: 75.08 (with a change of +5.27)
Customer Reviews: 11,874 (total), with monthly and yearly breakdowns (10,032 monthly, 1,982 yearly)

20 April 2025

20 April 2025

20 April 2025