Learn Anytime, Anywhere with Seven E-courses
20 April 2025
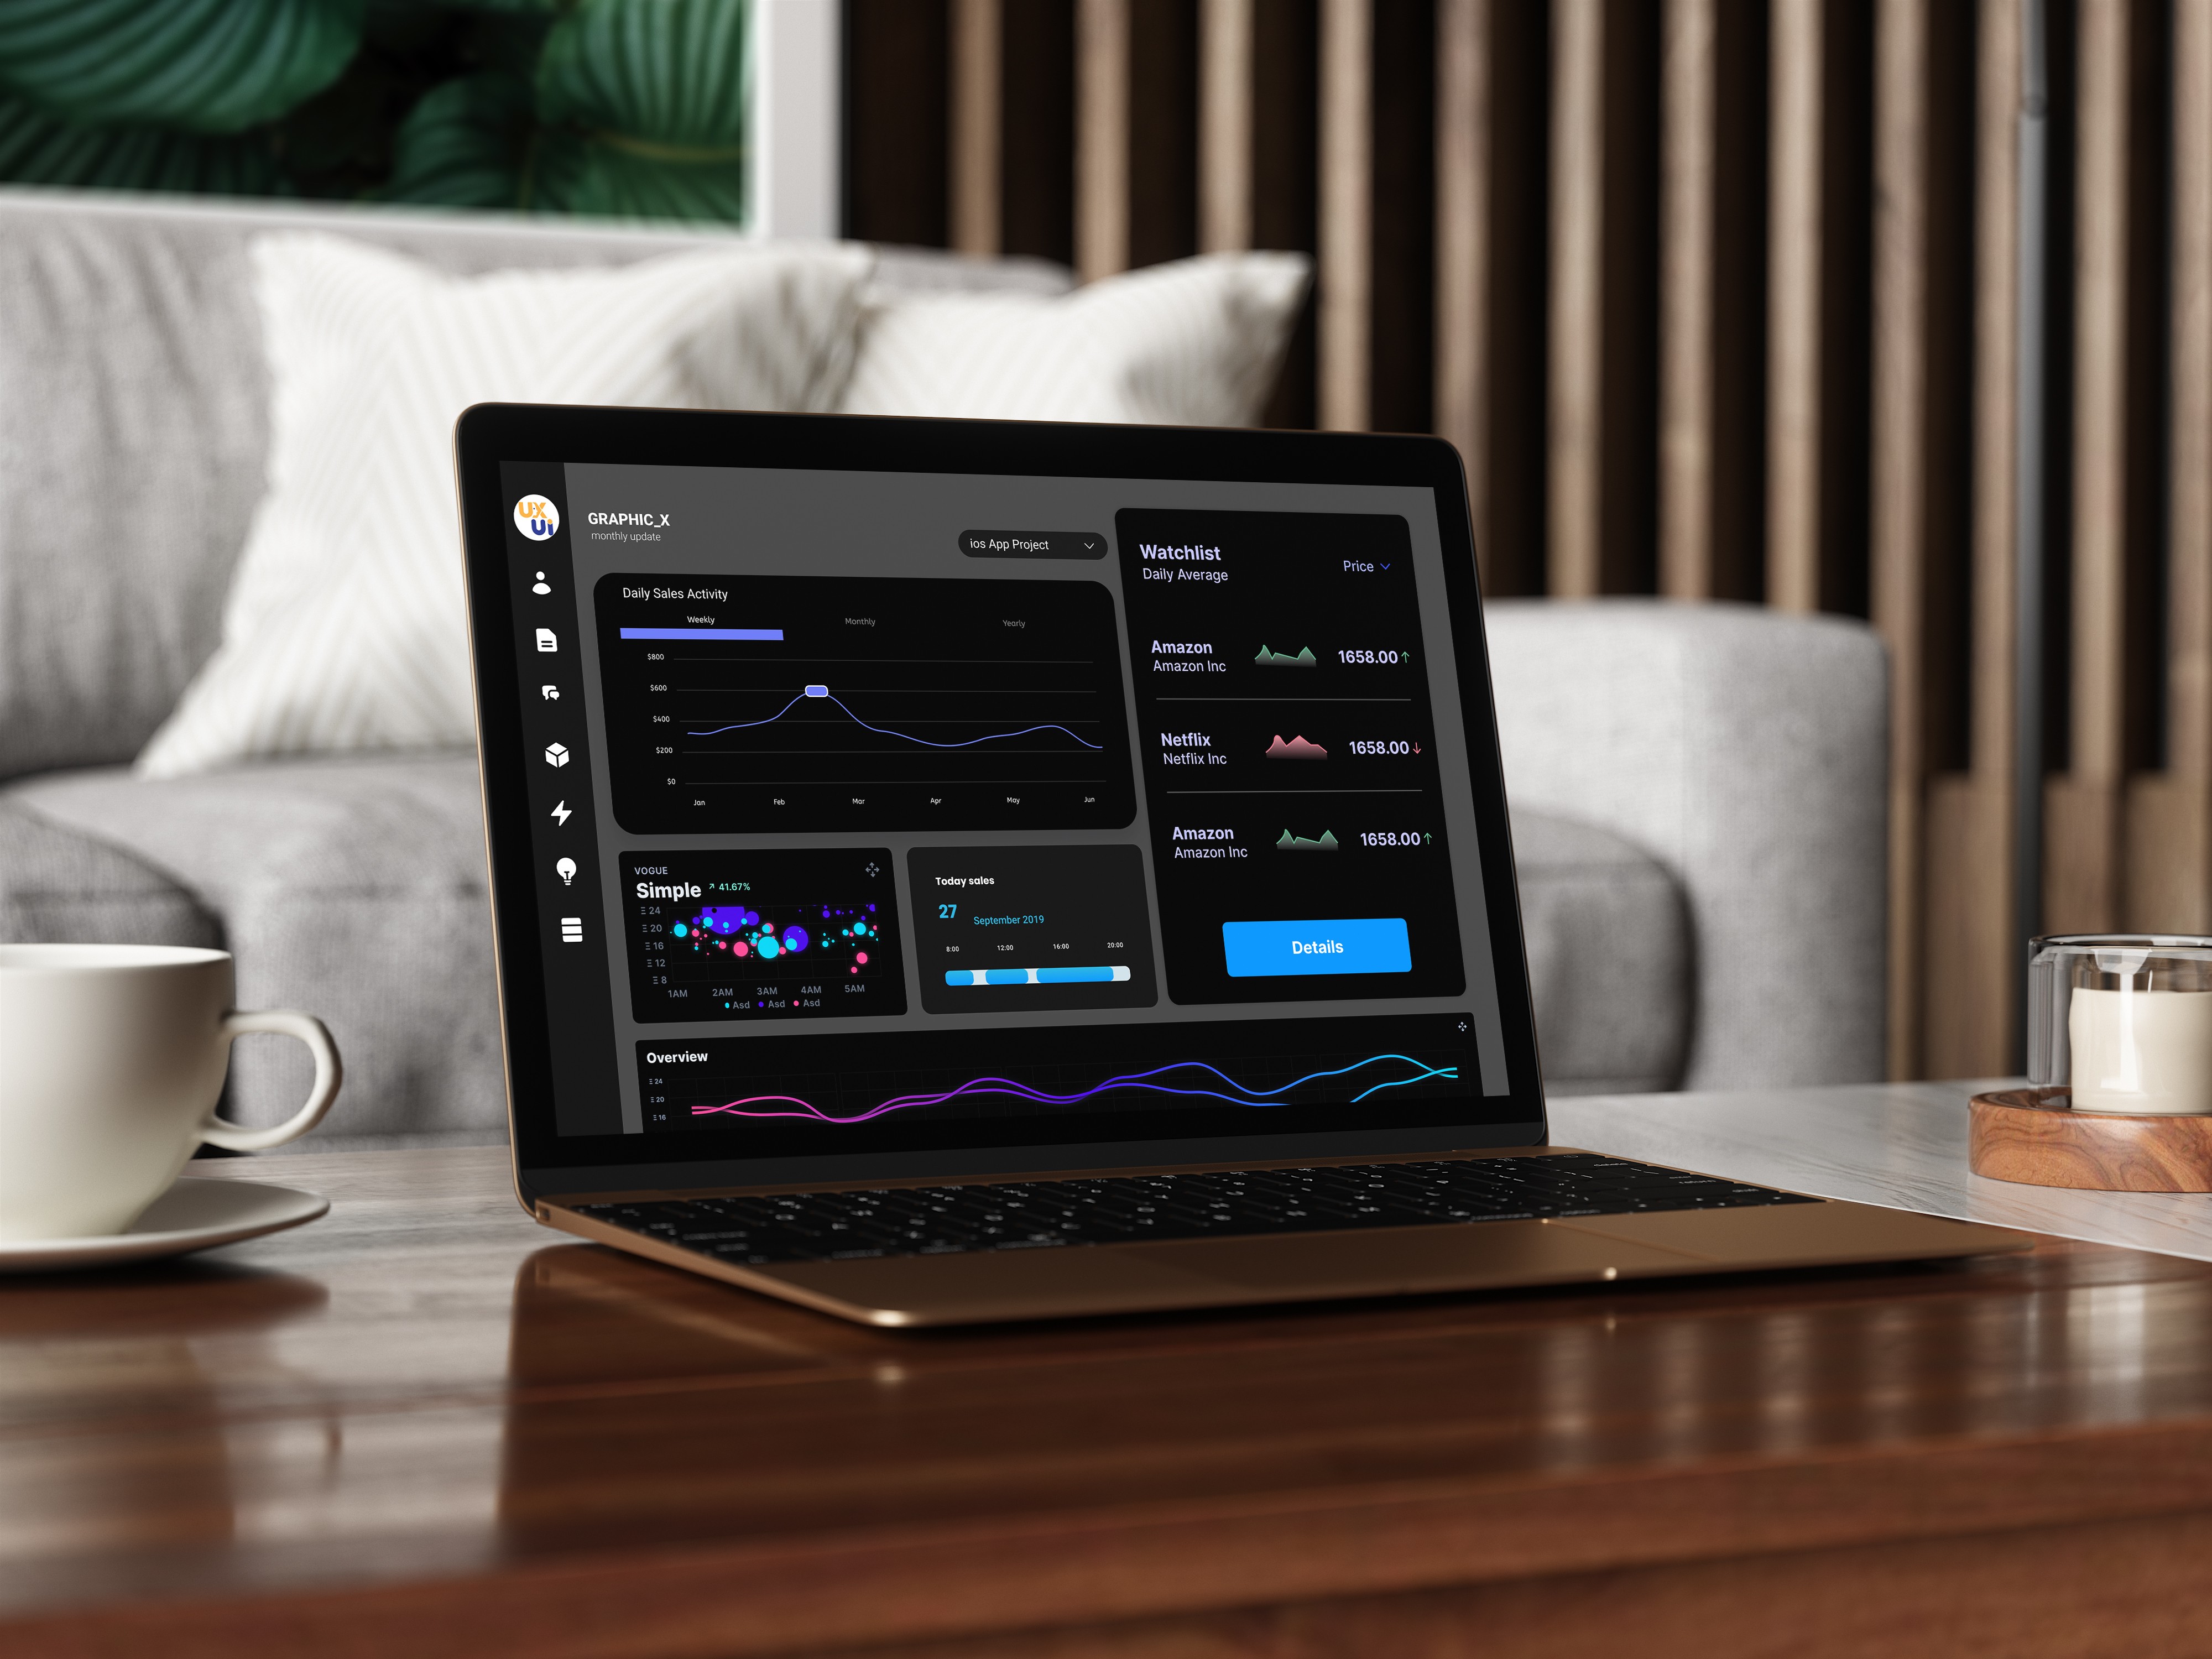
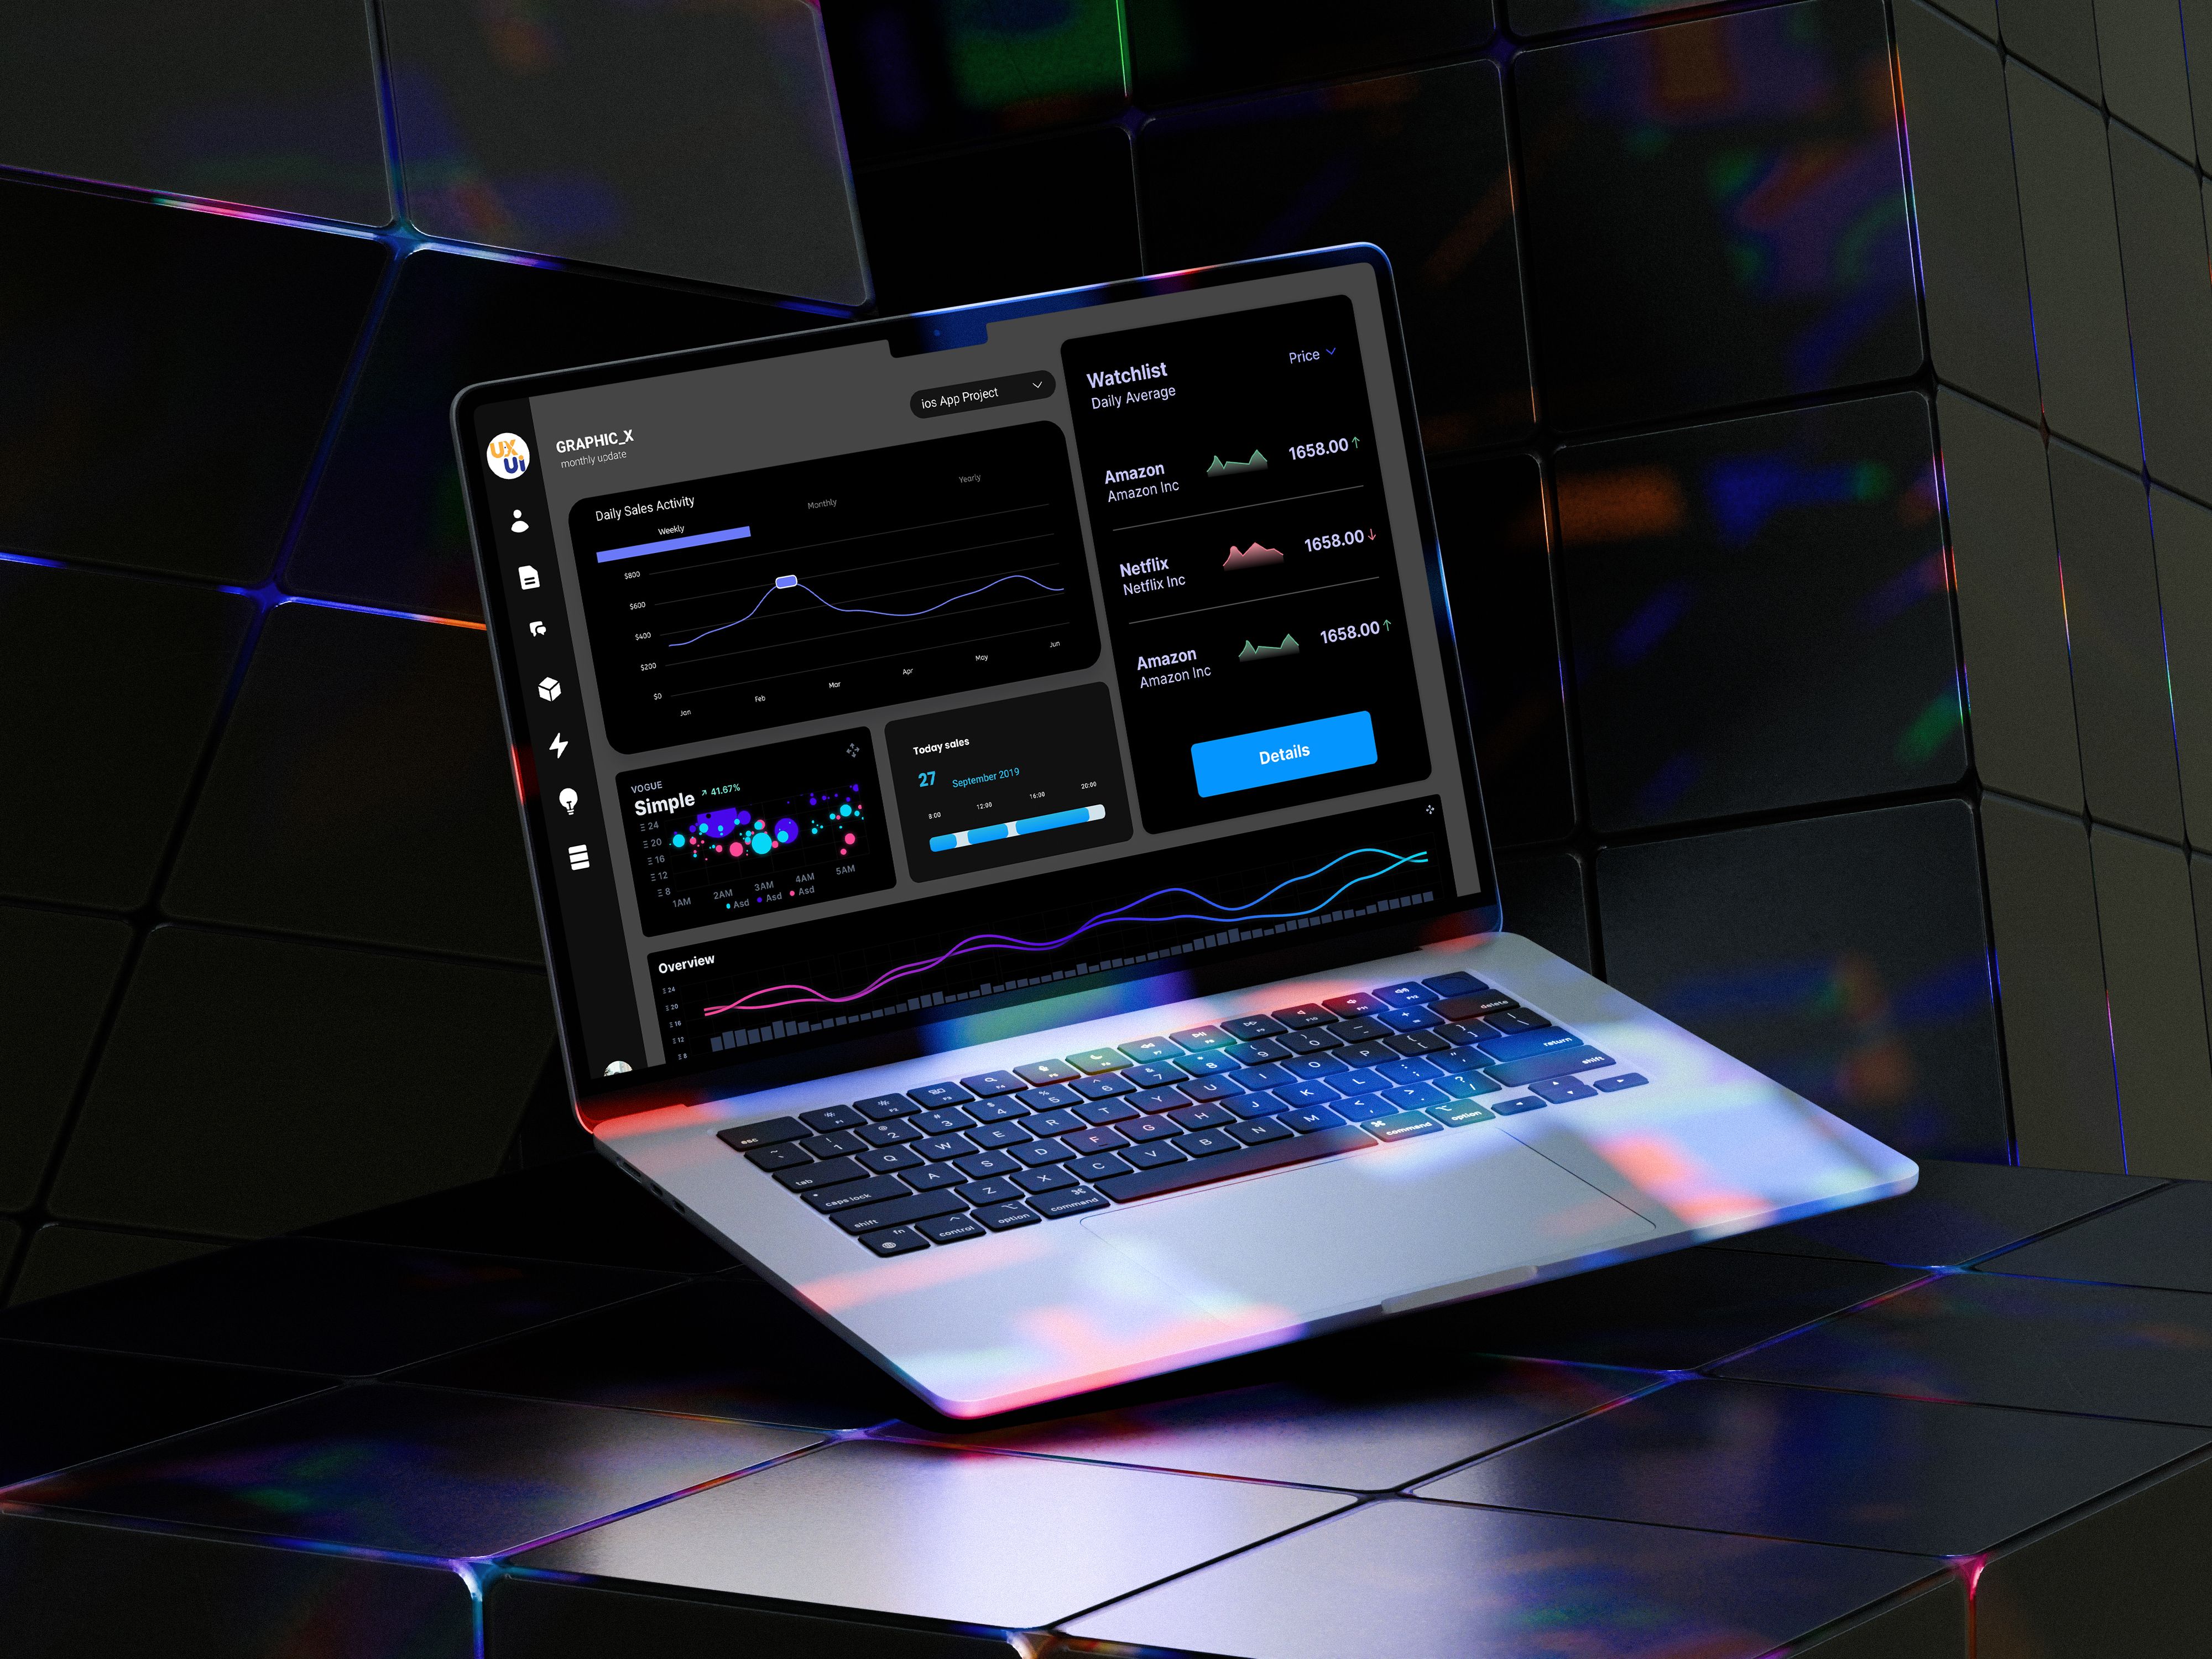
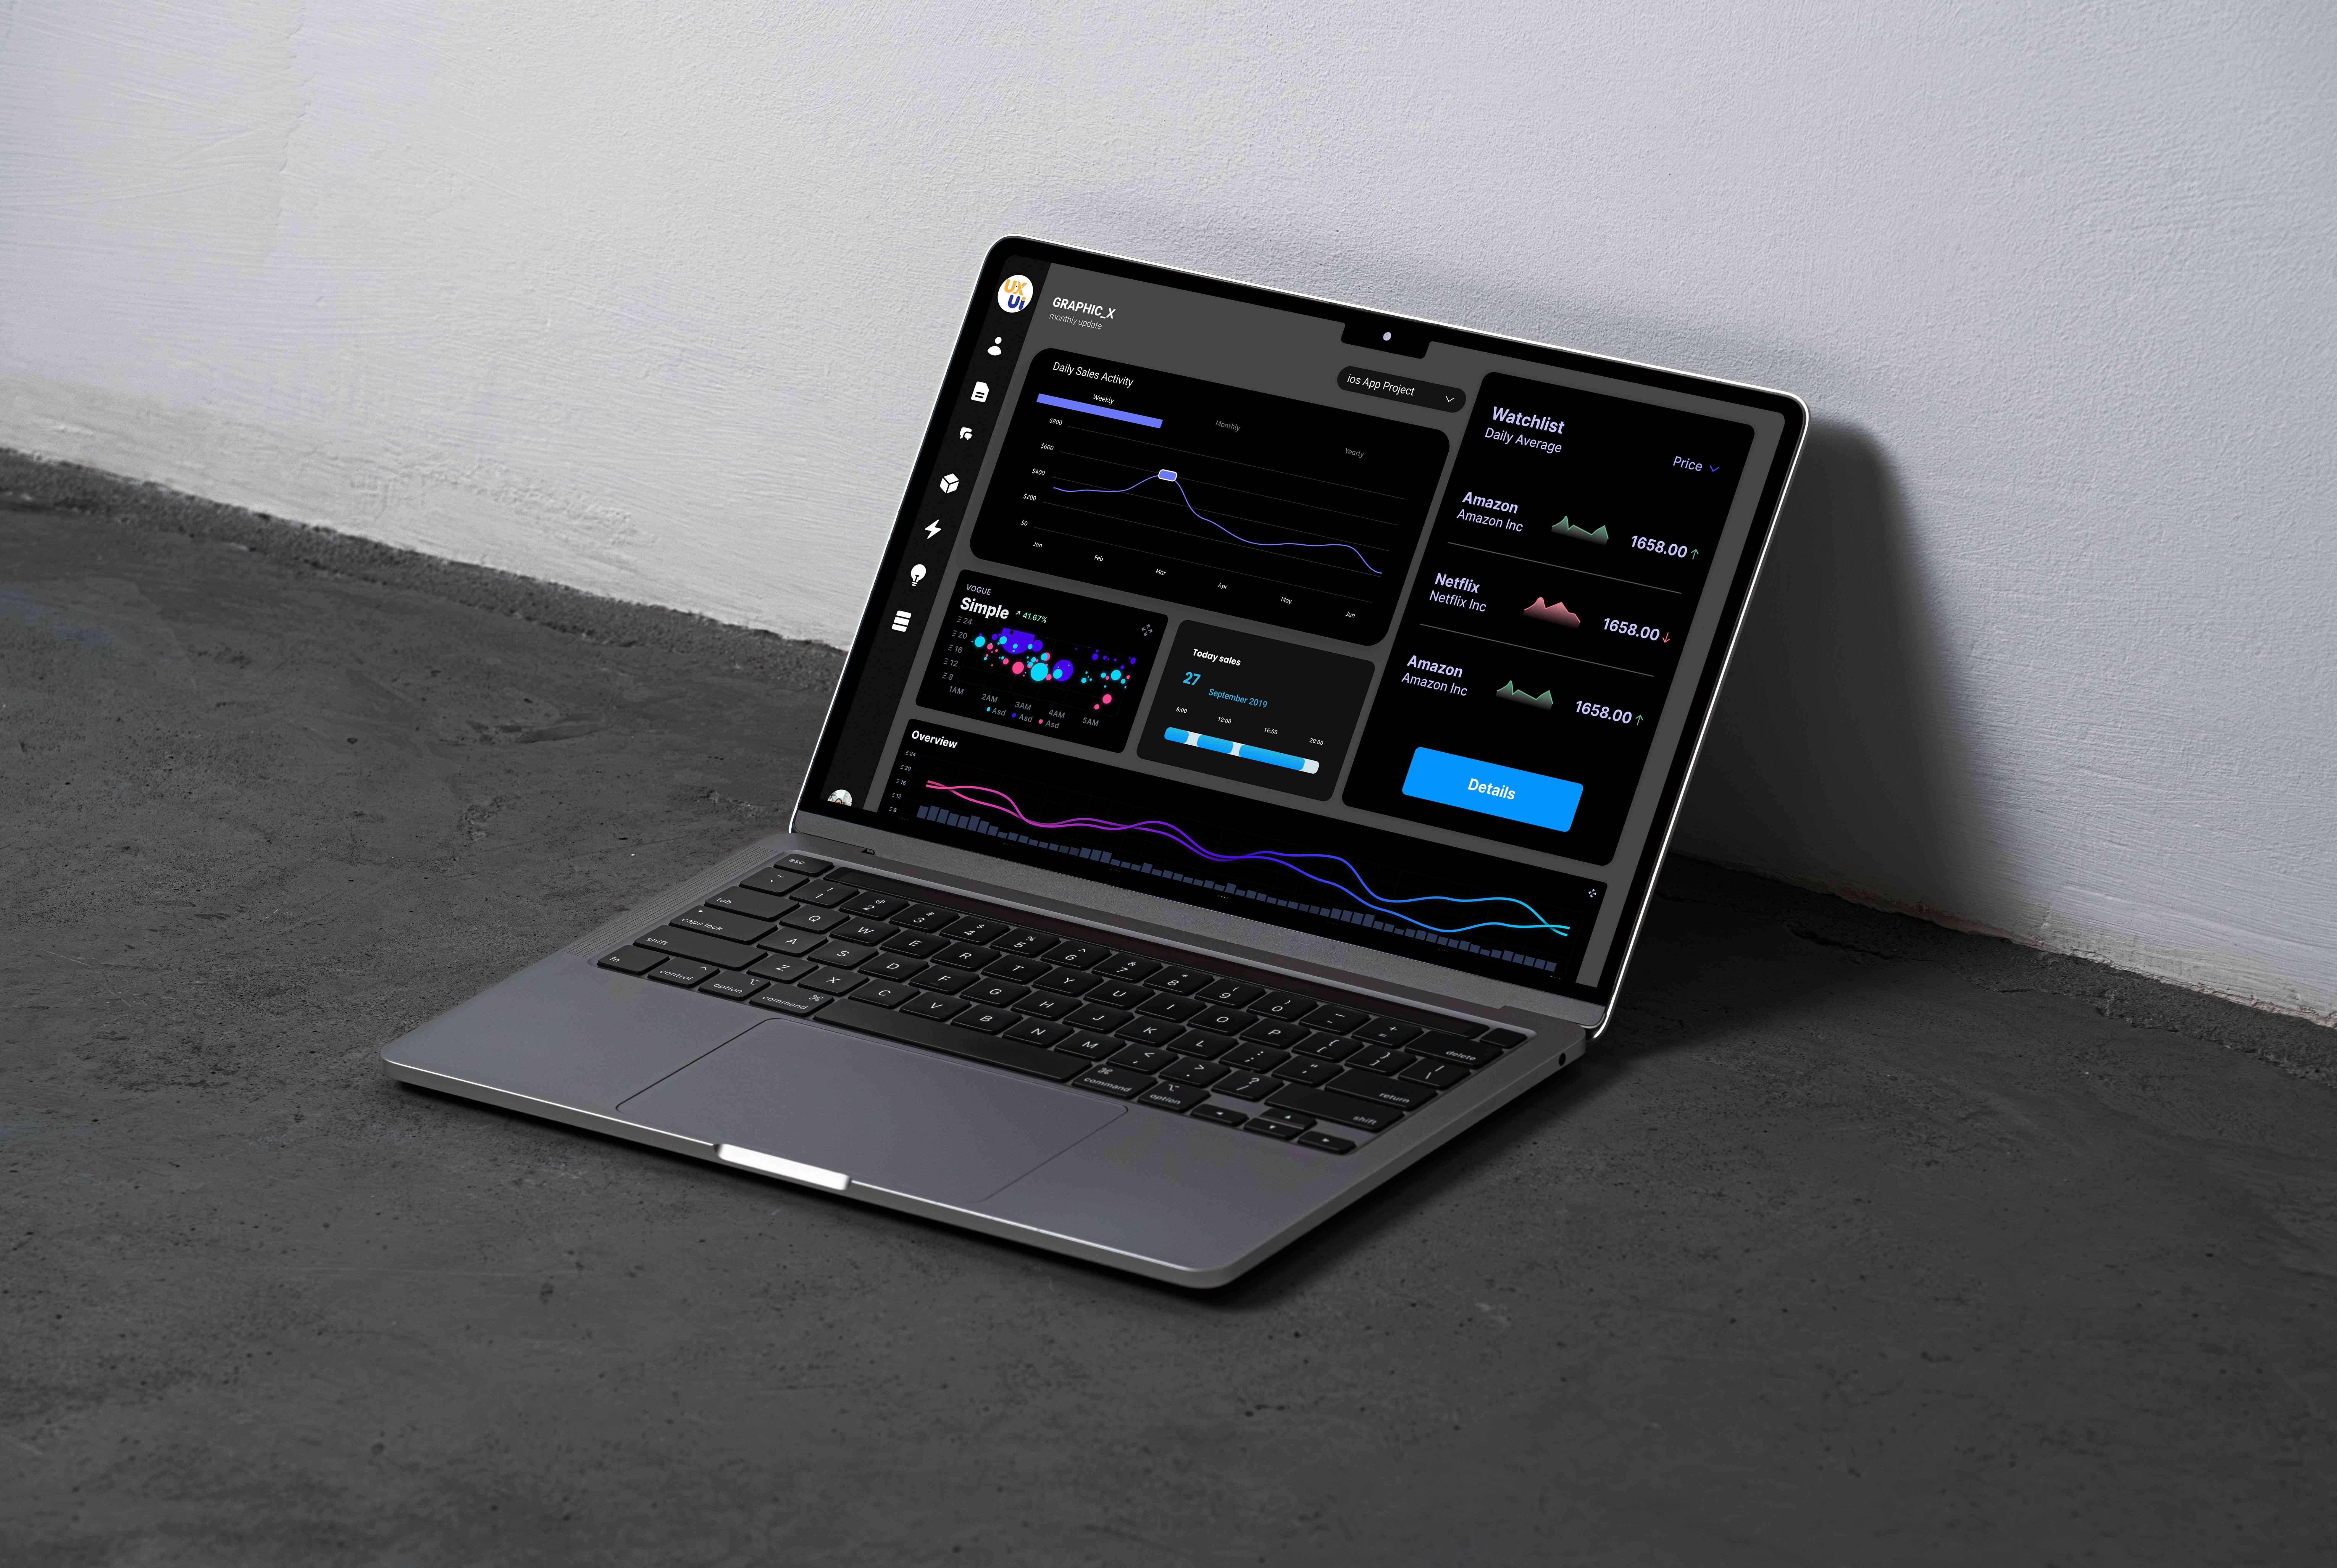
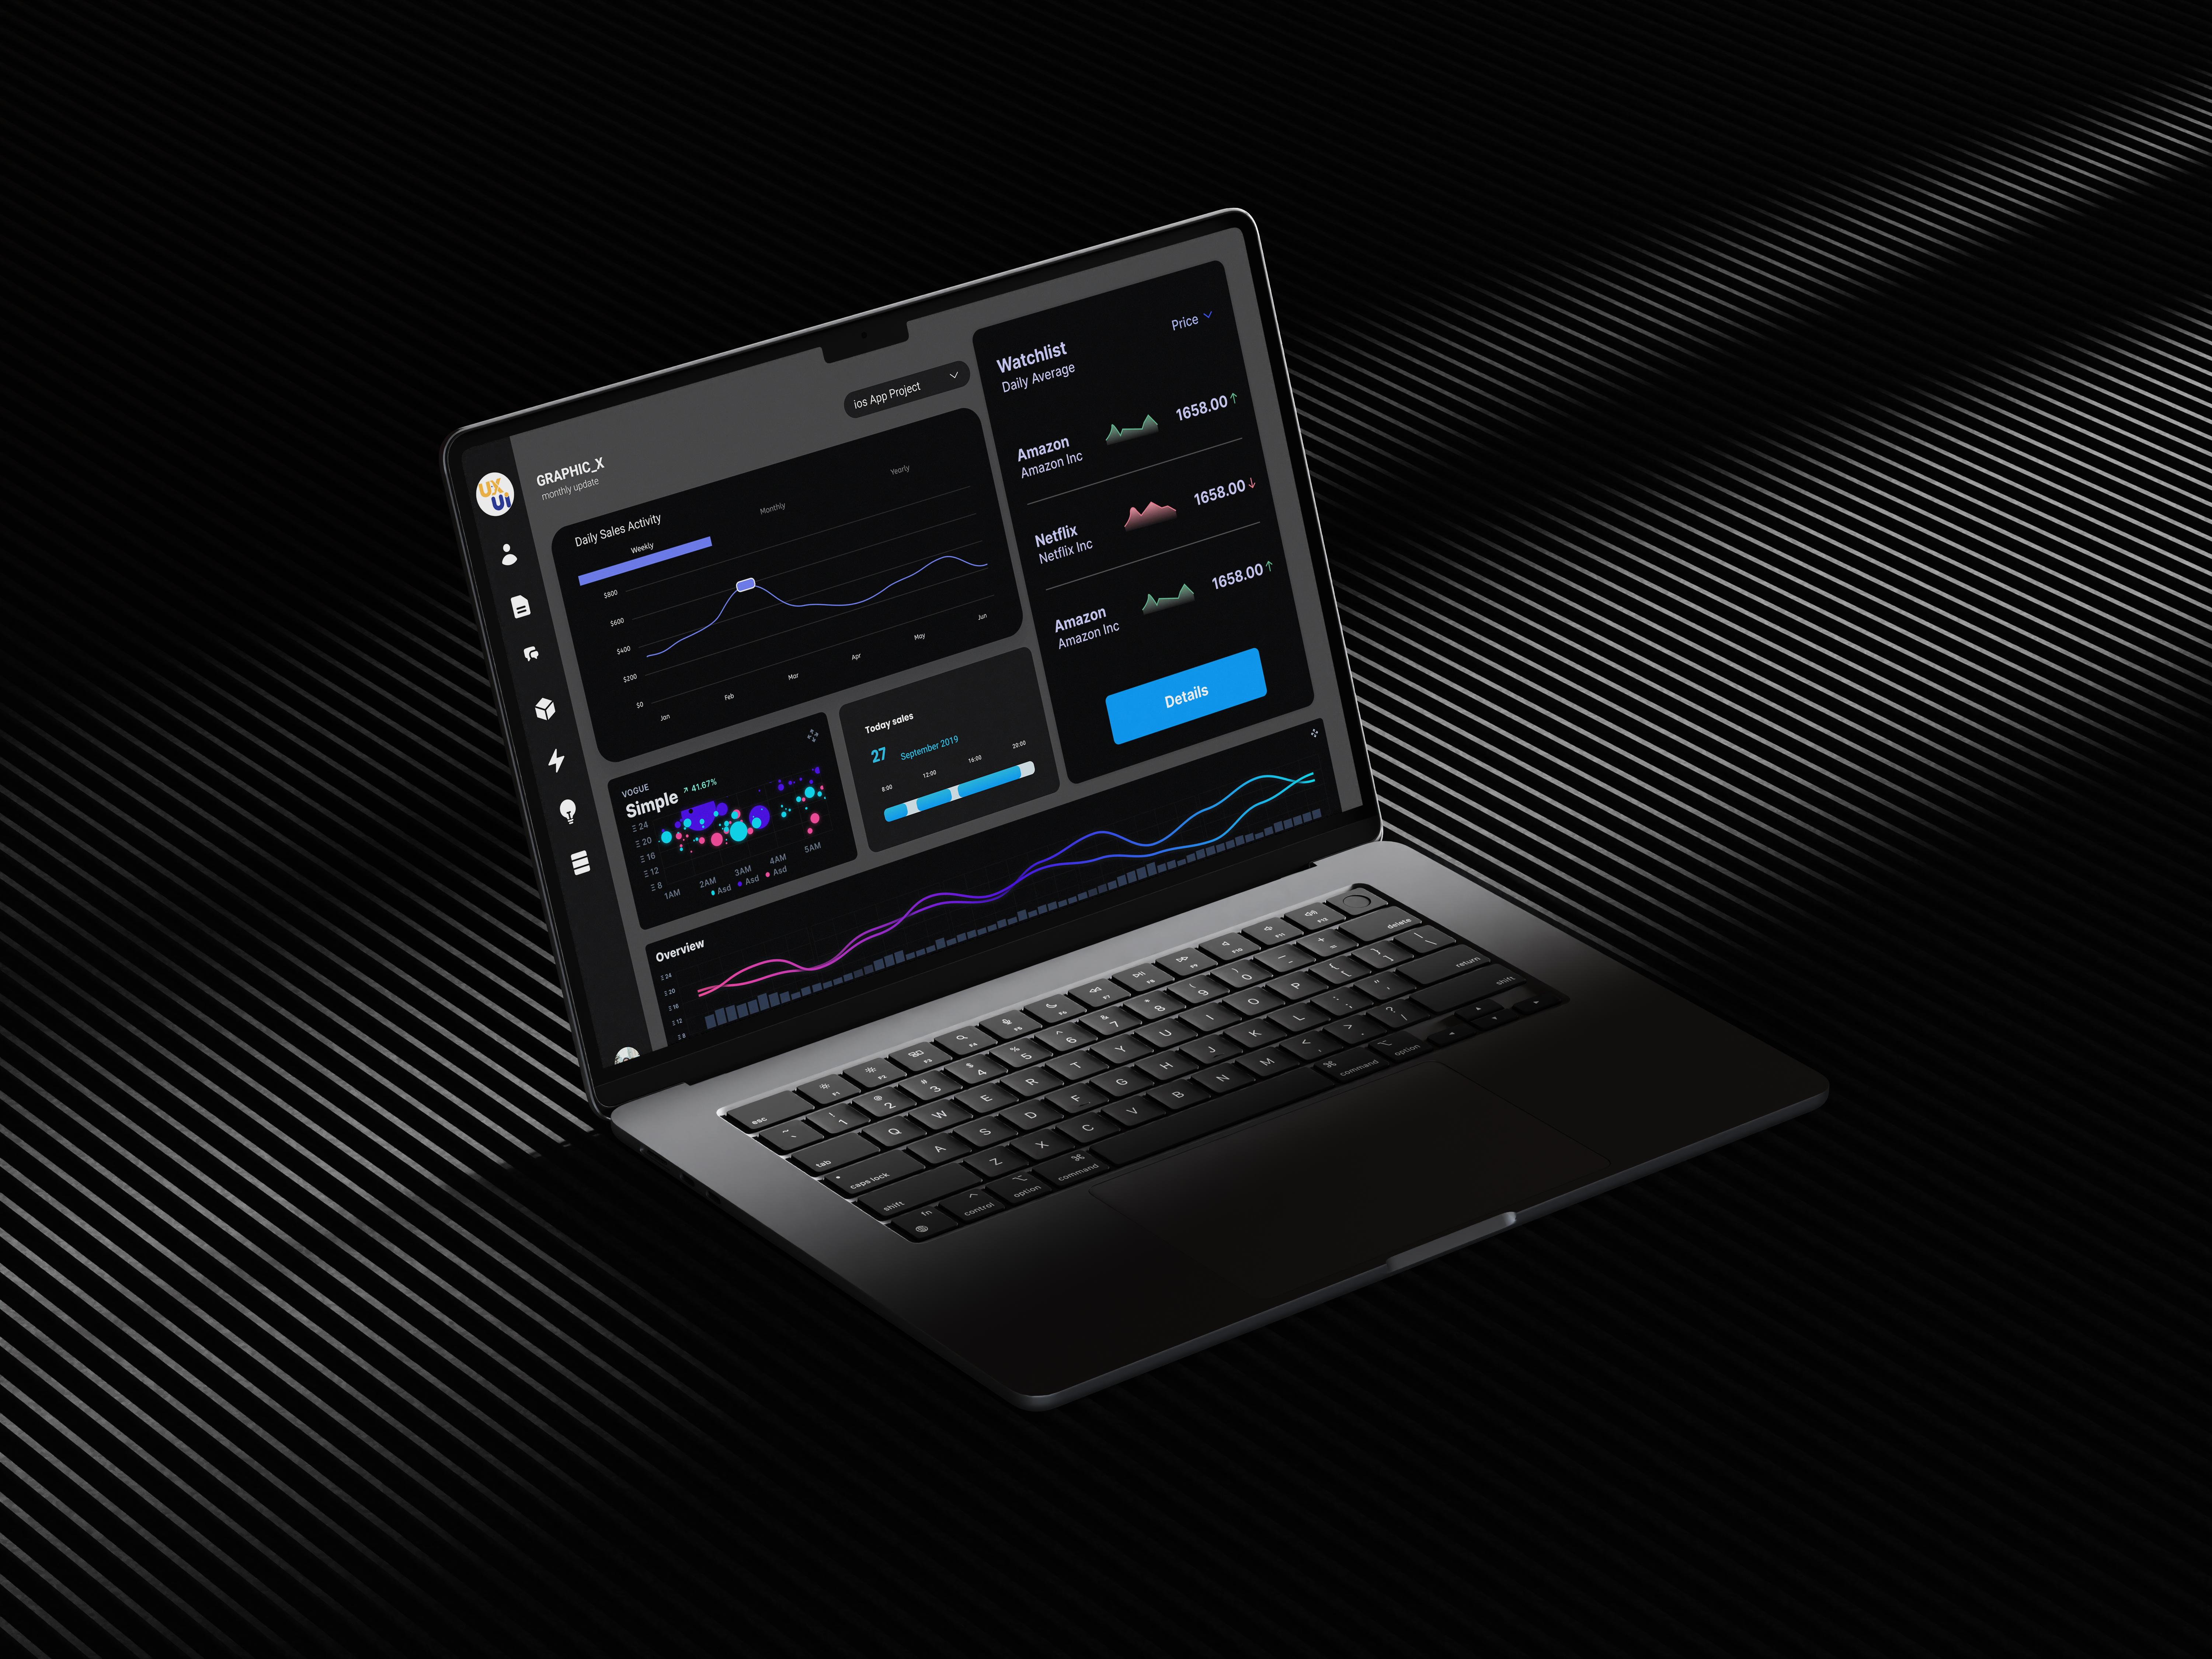
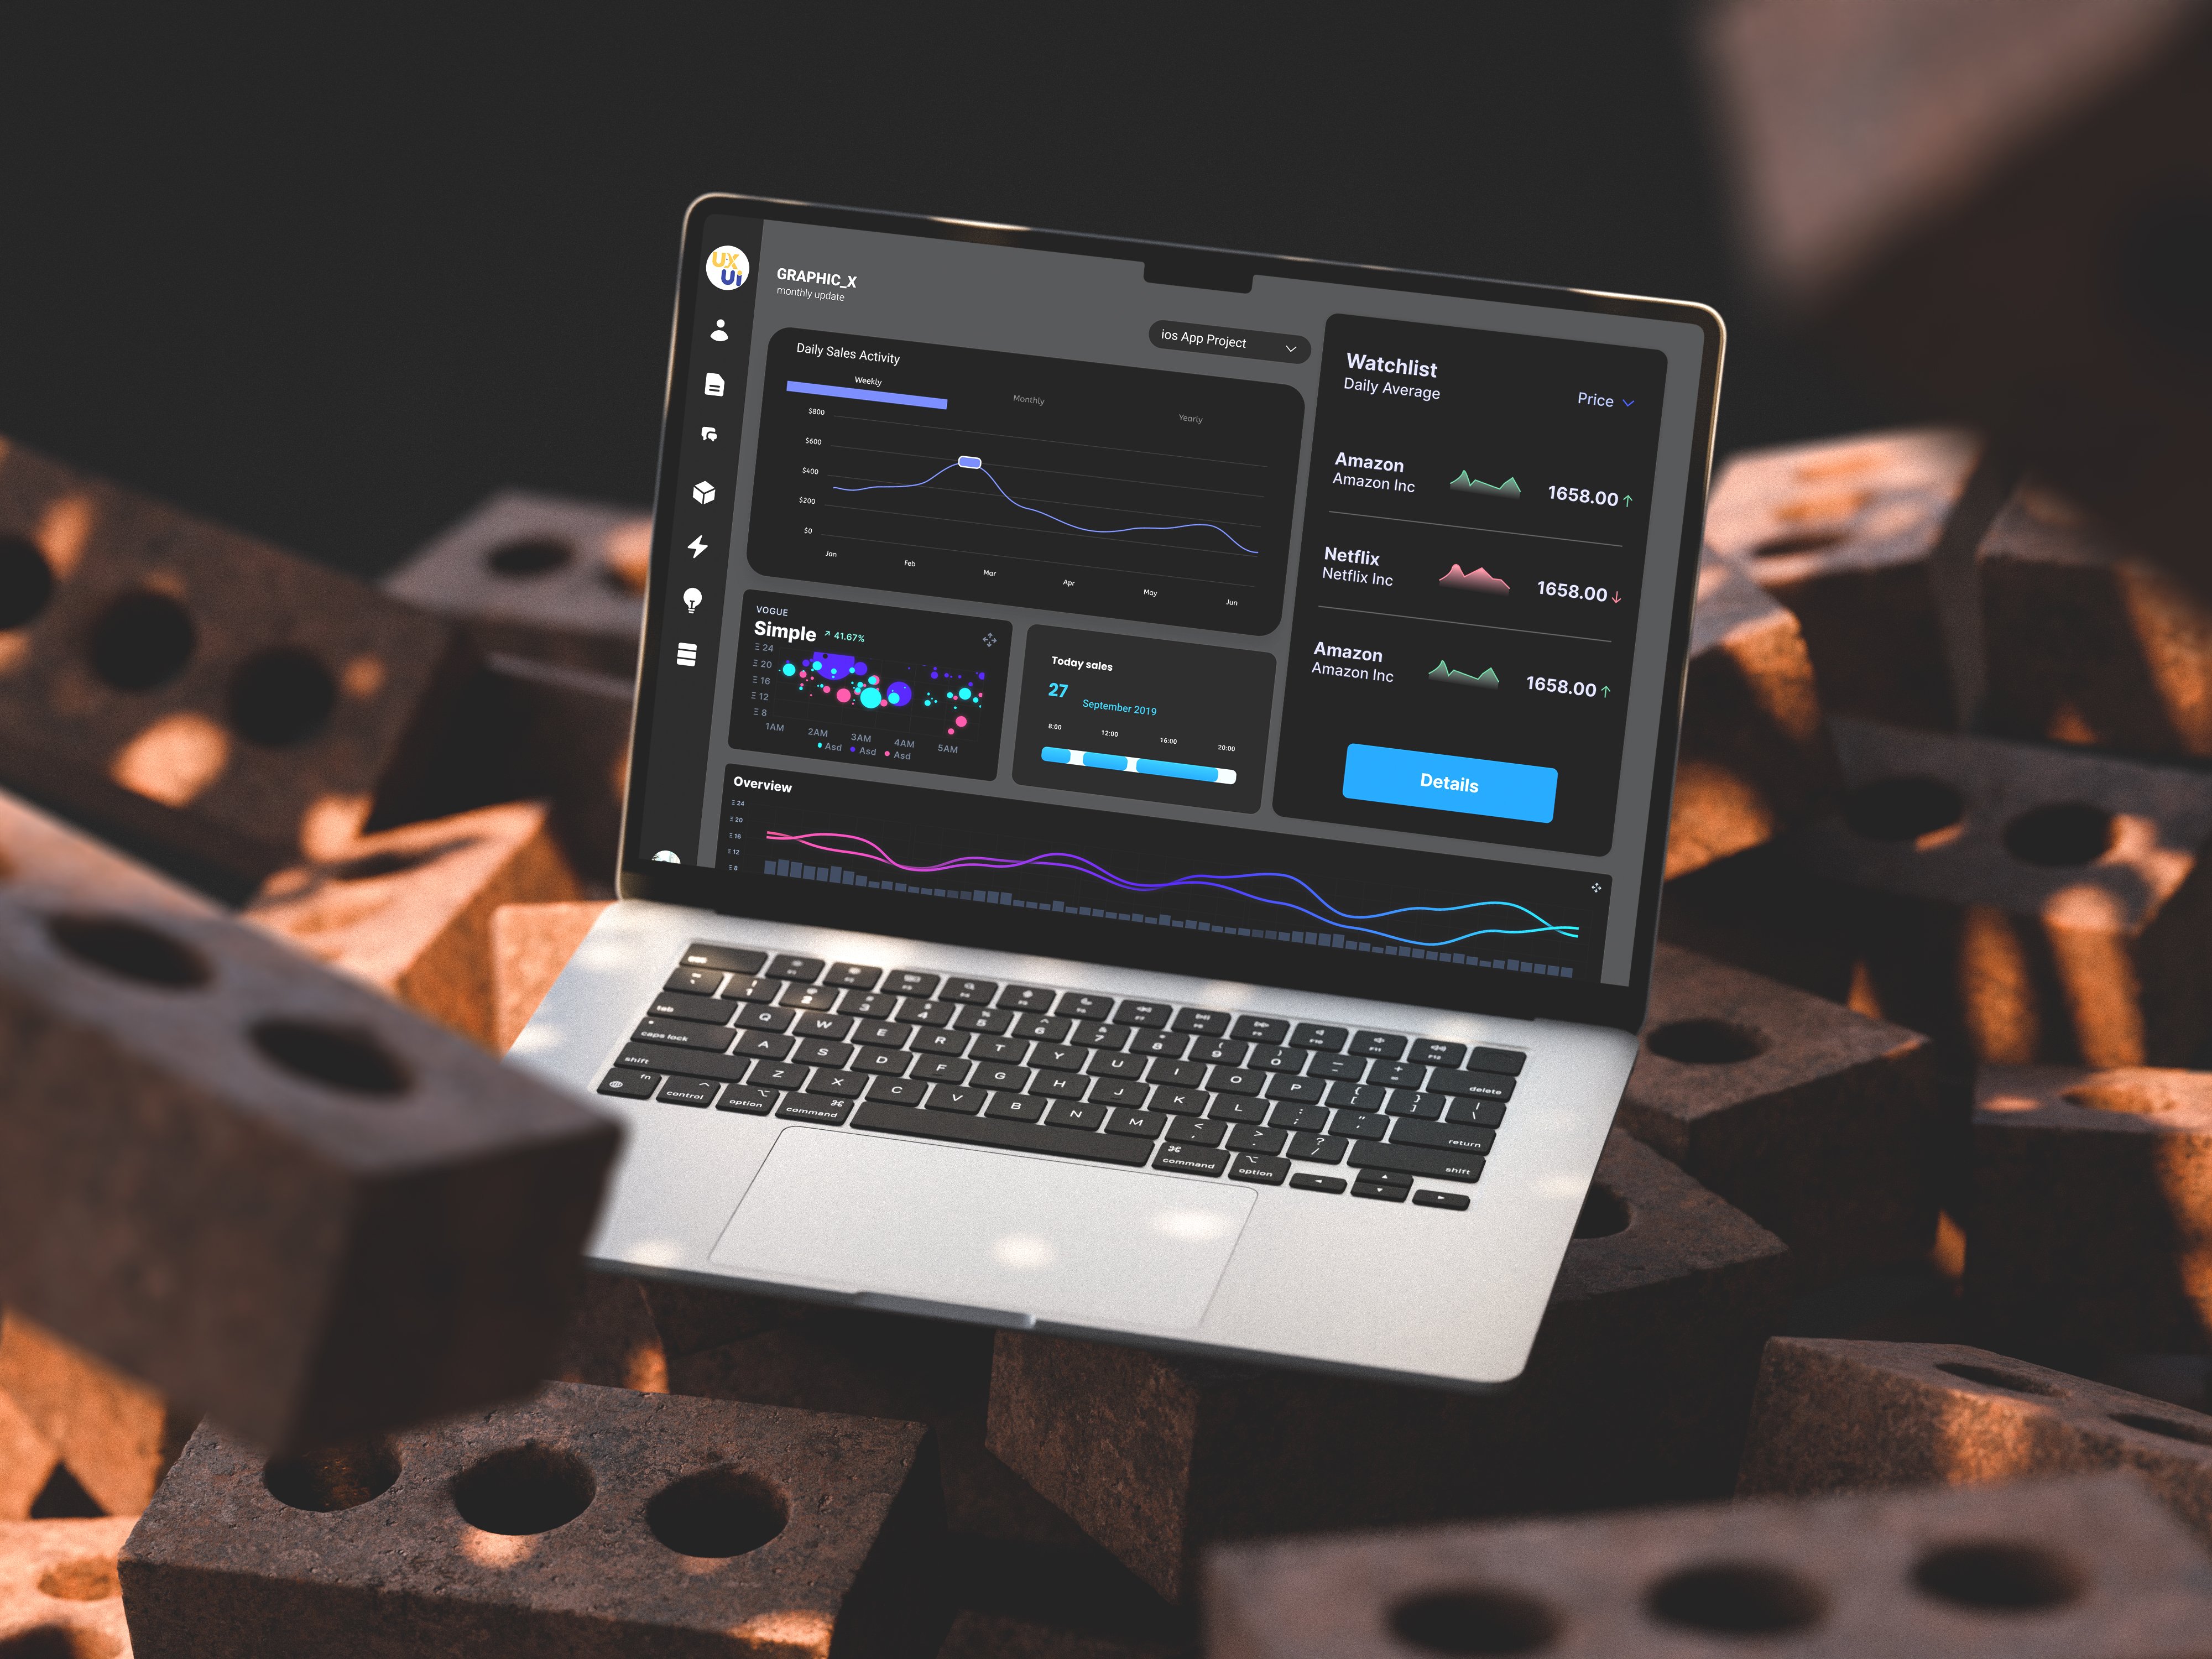
Top Section:
Project: iOS App Project (dropdown)
Watchlist (Daily Average):
Amazon Inc – 1658.00 ↑
Netflix Inc – 1658.00 ↑
Main Dashboard Panels:
Daily Sales Activity
Tabs: Weekly, Monthly, Yearly
Line chart showing fluctuation in sales
VOCSET: Simple (Bubble Chart)
Label: +8.21% growth
Multicolored bubbles showing performance metrics
Today Sales
Value: 27
Date: September 29th
Timeline bar below the stat
Overview (Line Chart)
Smooth line graph at the bottom tracking additional KPIs
Sidebar Navigation (Icons only)
Likely sections: Dashboard, Reports, Projects, Calendar, Settings (based on standard icon design)
Call-to-action Button:
Details (bright blue button in Watchlist panelhttps://www.behance.net/uiverse

20 April 2025

20 April 2025

20 April 2025